Looking for ideas/suggestions
-
I am asking for some ideas/advice on how to proceed with my current project.
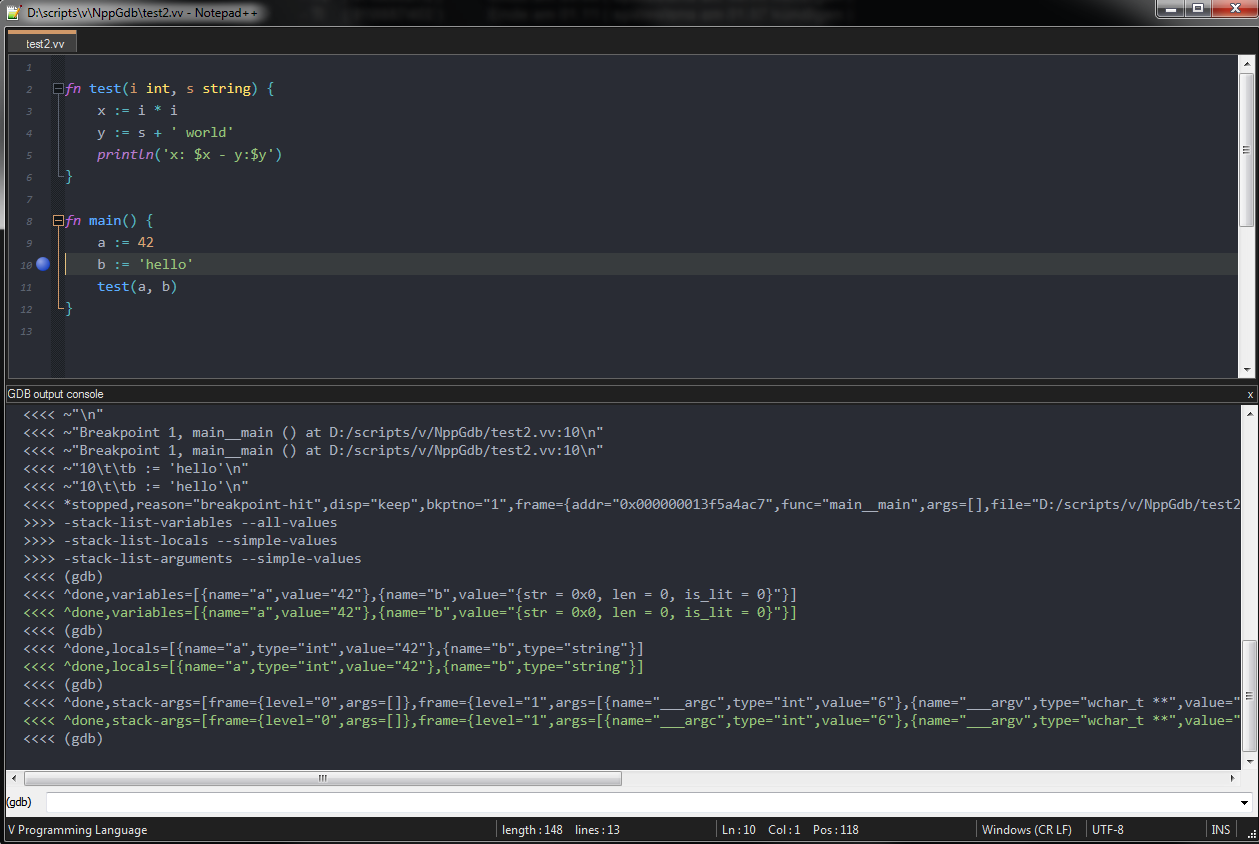
I am currently writing a gdb debugger interface for notepad++.
The main question I have is this: How does the debugger know which executable to launch?
I mean, we are working on code files, but the debugger needs to launch the resulting executable to do its job.
I would like to use NppExec in some way. That is, you create your profiles for C, C++, Rust, Go, V and whatever else is supported by gdb
and then you build and after that the debugging starts.And here we are now … how do I tell my debugger plugin to run executable X?
I know there is a npp message called msgtoplugin, but I don’t see how this can be used from NppExec, maybe I’m missing something.
Another idea might be to have NppExec create an environment variable that reads the debugger plugin on startup.
Doesn’t sound very trustworthy to me …
Forcing the plugin users to create a json, xml or whatever file to provide the needed information? Sounds annoying to me.Any other ideas on how I can try to implement it?
-
@Ekopalypse said in Looking for ideas/suggestions:
I am currently writing a gdb debugger interface for notepad++.
Please make it 64-bit compatible! I used to use DBGp Plugin for Notepad++ 32-bit (there is no 64-bit version) and I had it working with both Perl and Python - it was originally for PHP. I could not get it to work with C/C++ and gdb.
Alas, since switching to 64-bit N++, I’ve lost integrated debugging and now launch external debuggers through NppExec for Perl:
ENV_SET PERLDB_OPTS=RemotePort=127.0.0.1:9000
ENV_SET PERL5LIB=$(SYS.PERL5LIB);$(NPP_DIRECTORY)\plugins\PerlDebug
// $(CMD) perl.exe -d "$(FILE_NAME)" $(INPUT)
$(CMD) perl.exe -d:ptkdb "$(FILE_NAME)" $(INPUT)
and Python:
$(CMD) start $(CMD) %APPDATA%\Python\Scripts\winpdb3.bat -c "$(FILE_NAME)" $(INPUT)Still no way to do C/C++ and gdb in a GUI way I like.
Looking VERY forward to this plugin!!
Cheers.
-
@Ekopalypse said in Looking for ideas/suggestions:
Forcing the plugin users to create a json, xml or whatever file to provide the needed information? Sounds annoying to me.
Gdb is used to debug a process that was launched using some command line. The user should provide this command line. The user wants to provide this command line. Even if you could guess the executable name, anything other then initial hello world practices requires command line with parameters and setting the current directory and sometimes providing environment variables and who knows what other system parameters.
I don’t like either json or xml but the user need that control.
Come up with your own simple format that could be expanded later:my_prog.exe -s some_file --log-level info rundir: c:\work\my_prog env: INPUT_DIR=c:\inputA gdb launching plugin, when activated will expect current window to contain text in the relevant format where a valid command line will be enough as simple invocation.
If you really want to be advanced you could add syntax highlighter for the language you invent.
Very soon users will want to inject gdb configuration file and/or commands into the invocation. So repeated runs will set some breakpoints in advance, etc.
I wonder what kind of interaction are you going to add between gdb and Notepad++. Will you highlight the current line? Switch to the relevant file? Be able to add breakpoints from the source window in Notepad++?
Or do you just want a completely regular console based gdb session with the ability to see the code in the nearby pane?
-
@Michael-Vincent -
I’m afraid gdb only debugs executables, but once I have this implemented reasonably, it should be no problem to add interpreted languages as well and … currently it ONLY works on 64bit :-) -
The user wants to provide this command line
Makes sense.
Come up with your own simple format that could be expanded later:
That is what I’m currently doing.
D:\ProgramData\Compiler\mingw64\bin\gdb.exe
--interpreter=mi2 -q
D:\scripts\v\NppGdb\test2.exe
-v 1 -v 2 3
…
Yes, the user usually uses keyboard shortcuts to start the debugger
and control it, like stepping etc…
This already works. The posted image doesn’t really show it, I must admit. The console is just to see what was sent and received, and eventually the user is supposed to use the edit control of the comob box to execute other gdb commands that are not covered by the basic debugger functions like steps …So yes, as soon as the user calls a function that is in a file that is not yet loaded into Npp, the debugger loads the file and highlights the current line where debugging is taking place.
-
Perhaps this little gif will give you a better idea of what I’m trying to accomplish with the debugger interaction.

-
@Ekopalypse said in Looking for ideas/suggestions:
Perhaps this little gif will give you a better idea of what I’m trying to accomplish with the debugger interaction.
What do I miss?
I don’t see a “little gif”. -
https://s9.gifyu.com/images/debugger.gif
I see it just fine – it’s an animated gif, so cannot just be hosted here, but it’s properly embedded in Eko’s post.
-
If you want to invoke NppExec from within your plugin - e.g. to delegate actual running of executables to NppExec’s Console - there is an existing NppExec API for external plugins that allows to do it.
The main header with all the available messages as well as with examples is here:
https://github.com/d0vgan/nppexec/blob/master/NppExec/src/PluginCommunication/nppexec_msgs.hMoreover, there is a project NppExecPluginMsgTester that actually uses all of these messages to demonstrate how NppExec can be invoked by another plugin:
https://github.com/d0vgan/nppexec/tree/master/NppExecPluginMsgTesterIn case of further questions, feel free to contact me.
-
@PeterJones said in Looking for ideas/suggestions:
I see it just fine – it’s an animated gif, so cannot just be hosted here, but it’s properly embedded in Eko’s post.
Ah, maybe my I.T. blocks gifyu. I will have to check it from home. This thread is definitely interesting.
-
@Vitaliy-Dovgan said in Looking for ideas/suggestions:
In case of further questions, feel free to contact me.
Thx, I did.