DAP client plugin
-
-
I tried it out briefly.
Unfortunately (not your plugin’s fault), I was not able to figure out how to make the Perl debugger talk “DAP”, despite a few hours with AI suggestions.
I was able to replicate your Python config, and that did work, so I guess I’ll be starting to use that if I want to single-step through Python. So thanks.
-
Unfortunately I was not able to figure out how to make the Perl debugger talk “DAP”
If you have the Rust toolchain installed, there’s a
perl-dapbinary crate.Obviously Notepad++ is no listed as a supported IDE, but the (VS Code) setup guide might be worth looking at: https://github.com/EffortlessMetrics/perl-lsp/blob/master/docs/how-to/DEBUGGING.md
-
@Ekopalypse , is this supposed to be a multi-language type debugger launching tool? IE, if you have a debugger for your language, it can be called up in the NPP environment? Of is this something more specific? Reading the description, and loooking at the sample configs you posted, I’m assuming that’s what this is. Any guidance would be appreciated.
-
Which debugger did you use?
The problem with all of them is—to quote the DAP specificationSince launching is debugger/runtime specific, the arguments for this request are not part of this specification.figuring out how to start them.
I do hope that they all have one thing in common: that they expect this as a valid JSON message, which I define aslaunch_args.I tried it using the link from @rdipardo, but unfortunately it didn’t work properly. I was able to run through my simple test code step by step, but the variables weren’t returned. That might be due to my configuration or setup, though.
@lycan-thrope
Yes, as long as the debugger supports dap there is a chance that it will work with this client.Note that all dialog boxes are Scintilla controls and are not protected by the “Read-only” setting. However, this should not be a problem, with the exception of the Breakpoint View, where the client receives information about which breakpoints are currently set. The markers in the source code—currently only in the active document—are removed after the debugging session stops, but they remain in the breakpoint view so they can be reused in a later debugging session.
The exception, of course, is if I click on an already set breakpoint again; then it is also deleted, and of course if I select and delete something in the breakpoint view…Just for reference the config I used for the linked perl-dap
[perl] debugger = "C:/WHATEVER_DIR/perl-dap.exe" debugger_args = ["--stdio"] mode = "io" # debugger_args = ["--socket", "--port", "13603"] # mode = "tcp" # host = "127.0.0.1" # port = 13603 env = { PATH="C:/compilers/strawberry-perl-5.42.2.1/perl/bin", } launch_args = '''{ "program": "C:/repos/nppdebugger/tests/debuggees/perl/test.pl", "cwd": "C:/repos/nppdebugger/tests/debuggees/perl", "perlPath": "C:/compilers/strawberry-perl-5.42.2.1/perl/bin" }''' -
@lycan-thrope
Yes, as long as the debugger supports dap there is a chance that it will work with this client.Just when I thought I was done with the feature set and was working on a compilation of legacy dBASE language UDL’s, you bring me a new feature to try and work into the package. I have to say thanks (sarcastically) and I say thanks (sincerely) as that would be one more addition to making Notepad++ a more homogenous IDE alternative for dBASE programmers.
We have a debugger that runs (it’s a dBASE application as well) separate from the IDE, for those brave enough to use it. It does have a bit of a crashing issue, but that may be because the IDE and Debugger running concurrently are a huge draw on resources, and this might allow for smoother running via the Notepad++ environment link.
I guess I’ll have to get up to speed on this DAP and see what I need to learn about the debugger’s mechanism to see if it will work. I know I have a problem getting a file edited in Notepad++ to launch in dBASE, and one of those problems is the aformentioned issue @peterjones brought up in another thread, with the use of spaces in paths. dBASE doesn’t like them either, IIRC.
Sigh…I guess I better start looking this over, along with all the IRL chores I have to get done this season. :-)
-
you bring me a new feature to try and work into the package
I’m sooorrrryyy :D
get up to speed on this DAP and
In short, it is essentially a “standard” for how an application should communicate with a debugger.
The communication itself takes place via JSON with a header section and is transmitted either via stdio or TCP.
Each side can send a request, which must be answered by the other side with a response, and in addition,
both sides can send events, which are simply pieces of information that do not require a response.
It looks like thisContent-Length: 139 {"seq":29,"type":"event","event":"stopped","body":{"allThreadsStopped":true,"hitBreakpointIds":[1],"reason":"breakpoint","threadId":13008}} Content-Length: 46 {"command":"threads","type":"request","seq":9} Content-Length: 180 {"seq":30,"type":"response","request_seq":9,"success":true,"command":"threads","body":{"threads":[{"id":10932,"name":"2: tid=10932 \"\""},{"id":13008,"name":"1: tid=13008 \"\""}]}} Content-Length: 47So, to make your dbase debugger dap-compatible, you need to wrap it in this layer and interpret it:
In the previous example, the client asks: Which threads are currently running?
And the dbase adapter would then have to convert this into dbase debugger commands and return the result wrapped in JSON.Of course, not all debuggers can support every feature, which is where capabilities come into play.
Before the actual debugging begins, the client and the debug-adapter exchange information about what each is capable of,
and only the appropriate requests should be used thereafter.along with all the IRL chores I have to get done this season
Those are exactly the things that keep holding me back.
I have no idea who came up with them, but… can’t we just fire that person?
I mean, obviously I’m not the only one this affects. :-D -
@rdipardo said:
If you have the Rust toolchain installed, there’s aperl-dapbinary crate.Hmph. I had been trying to find something in the perl ecosystem to enable DAP for perl. It’s counterintuitive to have to install a 1+ GB Rust toolchain just to connect a Perl debugger to Notepad++.
@ekopalypse [asked]](/post/105567):
Which debugger did you use?That’s the problem: I couldn’t find any perl-based ones myself; and the free AI I asked tried to get me to use a perl module that didn’t have features/functions/etc that it claimed to have, and when I looked into the documentation of that module, it didn’t mention anything about supporting DAP, so I’m not sure why the AI suggested it at all.
I was hoping to be able to try out perl debugging from Notepad++ “for fun”, if this plugin made it easy. But since the ecosystem is providing friction, I probably won’t be continuing down that path.
Though I’ll still pull out the plugin for when I want to single-step through Python… Now if it worked with PythonScript, so I could single-step while debugging N++ automation, I’d have it always enabled… So, if you have any ideas on that, I’m all ears. :-)
-
That’s the problem: I couldn’t find any perl-based ones myself;
As for Perl, there’s this project
The README file actually states that it doesn’t work on Windows,
because there are issues with asynchronous reading from stdin/stout.
Hmm… The question is, couldn’t we switch to TCP instead?
The transport layer usually only handles reading and writing, and if you abstract that,
the rest is already taken care of for LSP and DAP.Though I’ll still pull out the plugin for when I want to single-step through Python… Now if it worked with PythonScript, so I could single-step while debugging N++ automation, I’d have it always enabled… So, if you have any ideas on that, I’m all ears. :-)
I haven’t really looked into how debugpy works under the hood yet,
but I would guess that you’d have to proceed something like this.NppDebugger launches a second instance of Npp with the desired file.
In PythonScripts’ startup.py, debugpy must be loaded and the DAP server started.
NppDebugger connects to it and requests that the relevant script be launched.I’ll try this out over the course of the next week.
-
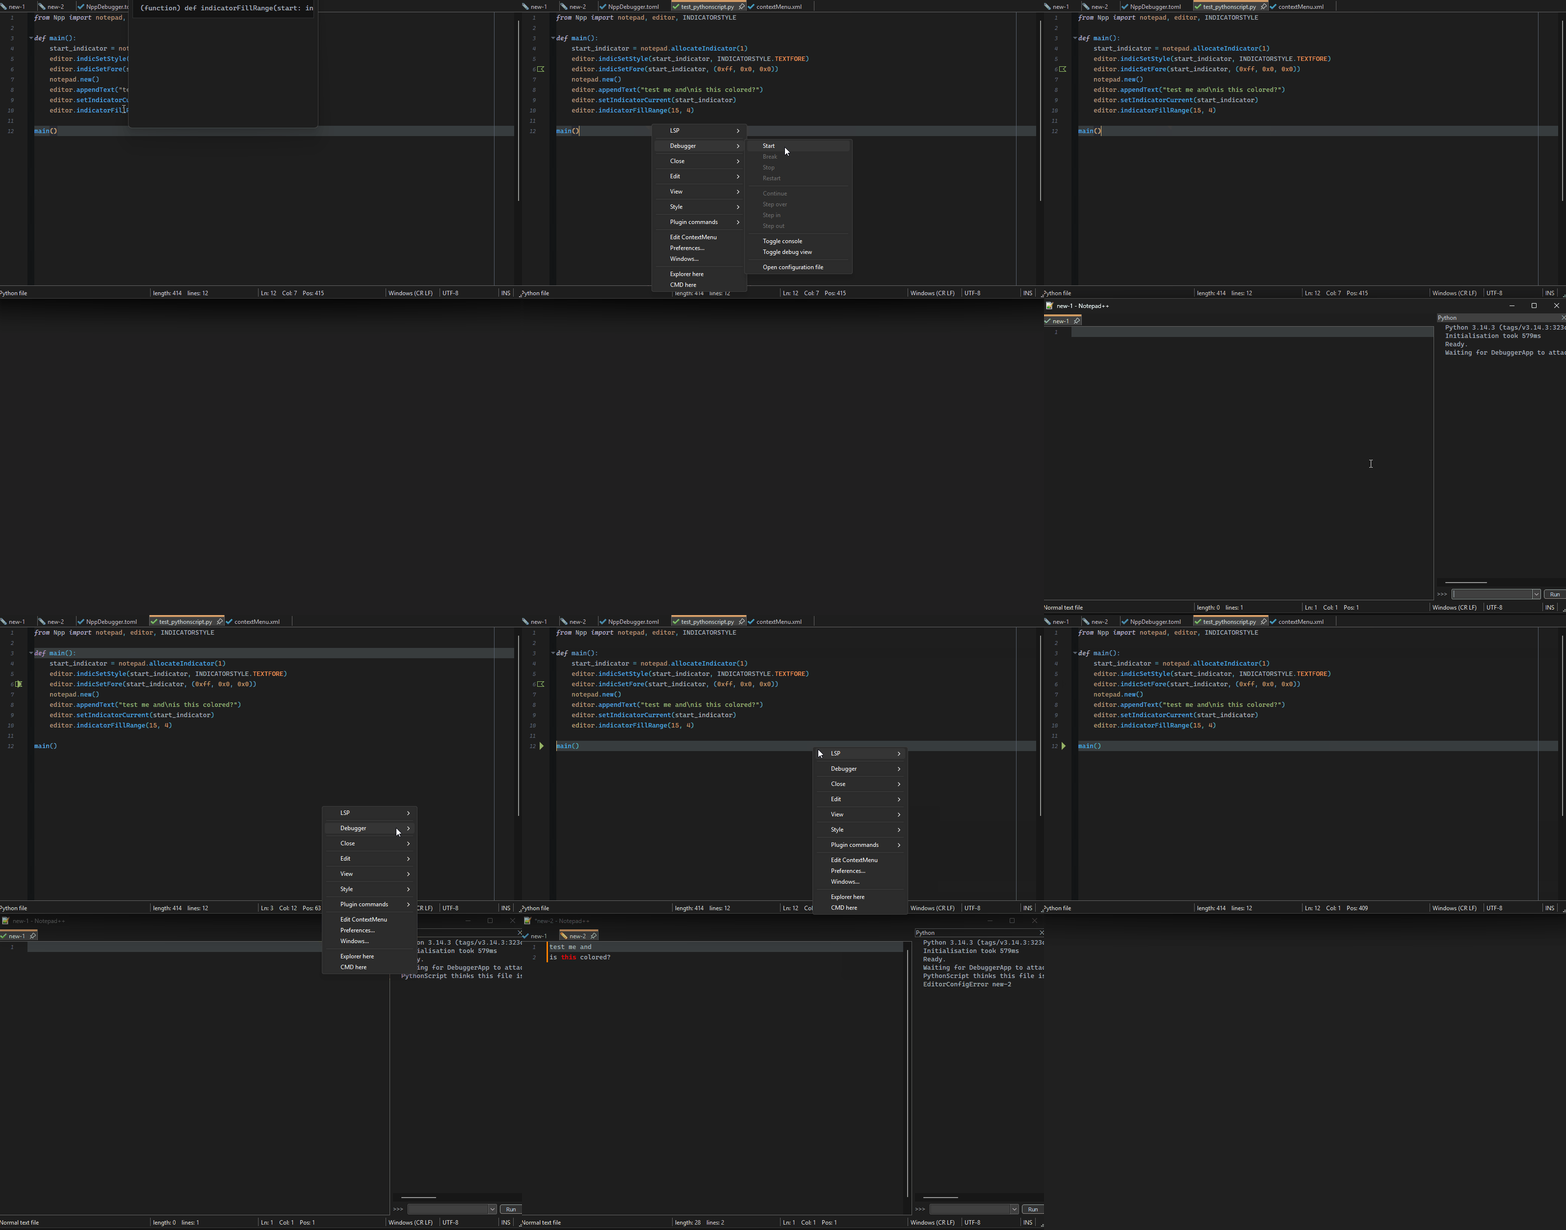
Okay, I got it working, but I need to revise the configuration section of NppDebugger.
Debugging PythonScript is fundamentally different from debugging “regular” Python programs.
Currently, however, NppDebugger selects the debugger based on the language, which no longer works in this case.
So I guess I need to introduce a “profile-like” approach, i.e., a language can have multiple debug adapters.
If multiple adapters are defined, we could display a small dialog to select the desired adapter.
Additionally, the debuggee process is currently terminated when the session ends, which is usually not a problem, but when debugging PythonScript, Npp itself is the debuggee process, and terminating it could leave plugins in an unexpected state, such as in my case, where NppLspClient can no longer perform its cleanup.
So I need an additional option to configure
the debuggee process so that it is not terminated after the debugging session ends.I hope another version will be available by the end of this week.
-
Those are exactly the things that keep holding me back.
I have no idea who came up with them, but… can’t we just fire that person?
I mean, obviously I’m not the only one this affects. :-D@Ekopalypse ,
I appreciate your research into this, and I’ll look at it again, later, at least for dBASE. The problem, however for dBASE is it’s IDE, which is a program that is a virtual machine , and unless I can control the dBASE IDE via, say, OLE, from Notepad++, it’s going to be an impossible attempt, as far as I know.It boils down to one of the problems I’ve been having trying to get a file edited in NPP, to open inside the dBASE IDE, which, essentially runs it, since after editing, you want the file compiled and run. Sending a file to the IDE doesn’t give the option of compile only, or run only. It does both. When it does both it will attempt to compile and run the file, but the problem is that the last active directory, is still hardcoded in the environment and the .ini file (any time it starts up) for the IDE, and will open there and then throw a database error , or file location error, and not allow the file to be opened. Much like Notepad++ won’t allow changes to it’s environment and files to be changed until restarted and reloaded.
Even using a slight of hand to bring up a directory file dialog box inside the IDE to allow going to the file, fails because the IDE environment STAYS in the last active directory. It requires changing that directory inside of the IDE to direct to the directory that can compile and run that file. Inside the IDE, one can compile and run, separately. Not from the outside, which I suspect is an unexpected security precaution.
There might be a way to change the .ini file settings before using Run to start the application, (something I may look at) but that’s a lot of trouble for varying paths, apps…etc., for something that should be simple if the communication was easier. I’m still looking at this aspect, at least as a possible solution for opening files in the IDE to be compiled and run, and would be a step toward the Debugger, but it’s not there yet and time, as we’ve mentioned, is at a bit of a premium right now. The problem with the Notepad++ Run (as well as the Windows Run) is that the path has to be hardcoded. It doesn’t work with the NPP Run variables being passed to the commandline path to open the dBASE IDE, but even if it did, the environment doesn’t allow for that path to change the “last active directory”.
I know, it’s frustrating. :-(
The easiest way I can think of, to better commmunicate, is if dBASE is an OLE server that Notepad++ can connect to and allow commands to be sent to the IDE to manipulate it from inside. If that is possible, then maybe that can then be put into, say, a PythonScript inside Notepad++ to automate the process. Unfortunately, searching the Notepad++ documentation, I don’t see any mention of Notepad++ being OLE capable.
As of right now, until I can either find out how to use text commands to the Debugger (which is also, an app run inside of the IDE runtime), or figure out how to use OLE with Notepad++ and the dBASE environment, communication with the standalone debugger app for dBASE will have to go on that way in the back burner.
Not ruling it out or giving up, just putting it where it has to go for now, until my understanding, knowledge and capability improves. In the meantime, I need to find that person causing all these IRL chores and have a talk with them…unfortunately, I suspect if I do start having a conversation with ‘him’, people will view me crazier than they already do. :-)
-
Unfortunately, I don’t know anything about dBase, but if it’s an OLE server, you could definitely control it using the PythonScript plugin—or, if I recall correctly, there was/is also an ActiveX plugin—provided those methods are available.
Is there a free version of the DBase version you’re using?
In the meantime, I need to find that person causing all these IRL chores and have a talk with them…unfortunately, I suspect if I do start having a conversation with ‘him’, people will view me crazier than they already do. :-)
Not me :) And if you find him, give him a good smack from me too :D
-
Now if it worked with PythonScript, so I could single-step while debugging N++ automation
To enable debugging of Python scripts, you need a local Python installation and must install the “debugpy” module.
Of course, the PythonScript plugin must also be able to access the local Python installation.
My test configuration looks like this[python.script] debugger = "C:/PortableApps/npp/notepad++.exe" debugger_args = ["-pluginMessage=PythonScript=run_in_debug_mode=C:/repos/nppdebugger/tests/debuggees/python/test_pythonscript.py"] mode = "tcp" host = "127.0.0.1" port = 5678 launch_args = '''{ "program": "C:/repos/nppdebugger/tests/debuggees/python/test_pythonscript.py" }'''In addition, you need a script to configure debugpy accordingly.
import os
os.environ["PYDEVD_DISABLE_FILE_VALIDATION"] = "1"

from Npp import console, notepad
import debugpy
import re

def main():
    cmd_line = notepad.getCommandLine()
    if "-pluginMessage=PythonScript=run_in_debug_mode" in cmd_line:
        debugpy.configure(python=r"C:\python\python314\python.exe")
        debugpy.listen(('127.0.0.1', 5678))

        console.write("Waiting for DebuggerApp to attach on port 5678...\n")
        console.show()

        matches = re.search(r'-pluginMessage=PythonScript=run_in_debug_mode=(.+?)(?>;|$)', cmd_line)
        if matches is None:
            console.writeError("Script to be debugged was not provided")
            return

        target_file = matches.group(1)

        debugpy.wait_for_client()

        console.write("PythonScript thinks this file is: " + __file__ + "\n")

        with open(target_file, 'r', encoding='utf-8') as f:
            script_content = f.read()

        code_obj = compile(script_content, target_file, 'exec')

        env = globals().copy()
        env['__file__'] = target_file
        env['__name__'] = '__main__'

        exec(code_obj, env)

main()
The key factors are the debugpy lines and the fact that the correct script is called as soon as the client connects to debugpy.
So, start debugging and run the script in the new NPP instance, and then you should be able to step through it.
EDIT: and of course the new v.0.0.2 version of NppDebugger is needed
-
Thanks for that. I now have a proof-of-concept setup for launching.
For future readers trying to replicate, here are a few notes I came up with while getting this working:
- I believe that @ekopalypse’s “PythonScript plugin must also be able to access the local Python installation” means to checkmark
☑ Prefer installed python librariesin the plugin config - that option requires that you copy the
python314.dllfrom the installed python overtop the copy in the pythonscript plugin directory - For whatever reason (whether it’s because I have a non-standard python location, or something else I don’t understand), that doesn’t actually make the plugin see my libraries (so it didn’t see
debugpyon my first try). To get around it, I usedpython -m sitefrom the command-line to find my normal sys.path for the installed python, then prepended those to my sys.path in my ATSTARTUP-enabledstartup.py. Hopefully, if you have a standard python installation, you won’t need that extra sys.path manipulation - “start debugging and run the script in the new NPP instance”: this was mildly unclear, but I found it seems to mean to do Plugins > NppDebugger > start, which launches the second instance, then to run the “configure debugpy accordingly” script (at first, I thought I had to run that script in the main, then start the debugger, then manually run the script-under-test in the new instance
@ekopalypse , I did have a question, though: Is the long-term plan for NppDebugger plugin (if there is one) to continue to have to hardcode the code-under-test in the NppDebugger.toml file? Or will you eventually enable setting it as something like
debugger_args = ["-pluginMessage=PythonScript=run_in_debug_mode=$(FULL_CURRENT_PATH)"]and"program": "$(FULL_CURRENT_PATH)", so that it will automatically run the debugger on the active program, rather than having to modify the TOML every time you want to change what file you’re debugging? Or is there something I don’t understand, and it can already do that? - I believe that @ekopalypse’s “PythonScript plugin must also be able to access the local Python installation” means to checkmark
-
Unfortunately, I don’t know anything about dBase, but if it’s an OLE server, you could definitely control it using the PythonScript plugin—or, if I recall correctly, there was/is also an ActiveX plugin—provided those methods are available.
It uses ActiveX objects, but I don’t believe it’s usable by them, hence as far as I know, OLE is the only way, unless I find out otherwise. Will check.
Is there a free version of the DBase version you’re using?
They have a Trial Version, as far as I know, but the website provider was shut down for awhile under one of those recent supply chain attacks that affected cPanel. I think it’s back up now, though, so you can check it at dBASE.com.
In the meantime, I need to find that person causing all these IRL chores and have a talk with them…unfortunately, I suspect if I do start having a conversation with ‘him’, people will view me crazier than they already do. :-)Not me :) And if you find him, give him a good smack from me too :D
What the heck, I already have to beat my self up, may as well do it for you, too. :-)
-
It all sounded so logical to me when I wrote it, but now that I’m reading it again, I have to agree with you—
that wasn’t my best explanation of how this is supposed to work. Thanks for clarifying, and yes,
Prefer installed Python librariesand a local Python installation are necessary in this scenario.Regarding sys.path, yes, that makes sense. I should have tested all of this in a sandbox; then I would have noticed how
my own setup differs from a standard installation.And yes, the procedure, which is ONLY necessary to debug PythonScript scripts, is that you have one Npp instance,
in which the script is debugged—let’s call it instance A—and another, let’s call this instance B,
in which the script to be debugged actually runs.So, Instance A starts the debugging session via
Plugins->NppDebugger->Start.
This results in a new Npp instance B being launched.
Now, in Instance B, the script that configures debugpy must be started.
This causes debugpy to launch another Python process pydevd which is the real python debugger.This means that NppDebugger, from Npp instance A, waits for debugpy in Npp instance B to start the
Python debugger pydevd AND for debugpy to start a TCP server to which NppDebugger can then connect.NppDebugger(tcp client) <-> debugy(tcp server) <-intern-> debugy(tcp client) <-> pydevd(tcp server)
As soon as NppDebugger establishes a connection, it begins communicating with debugpy via DAP messages.
Is the long-term plan …
Yes, ultimately, the plugin should be designed to minimize the need for manual configuration editing.
For debuggers that work with compiled source code, such as gdb, delve, lldb, etc.,
this is usually a project-specific setting and something that a user must set at least once per project.
I don’t see how the plugin could figure this out on its own.
For PythonScript debugging, a simple variable substitution, as you mentioned, seems sufficient.They have a Trial Version
If I find the time, I’ll give it a try… but that might take a while… :)
What the heck, …
:D - thank you :D




Hello! It looks like you're interested in this conversation, but you don't have an account yet.
Getting fed up of having to scroll through the same posts each visit? When you register for an account, you'll always come back to exactly where you were before, and choose to be notified of new replies (either via email, or push notification). You'll also be able to save bookmarks and upvote posts to show your appreciation to other community members.
With your input, this post could be even better 💗
Register Login